
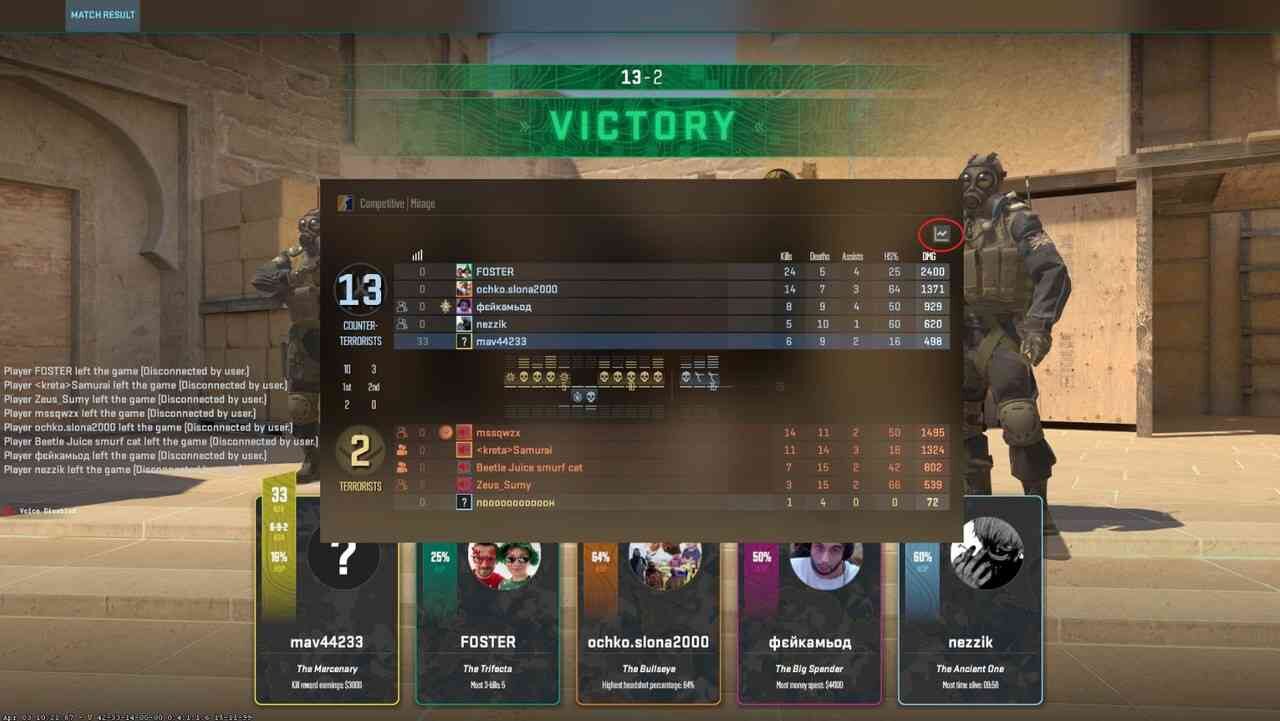
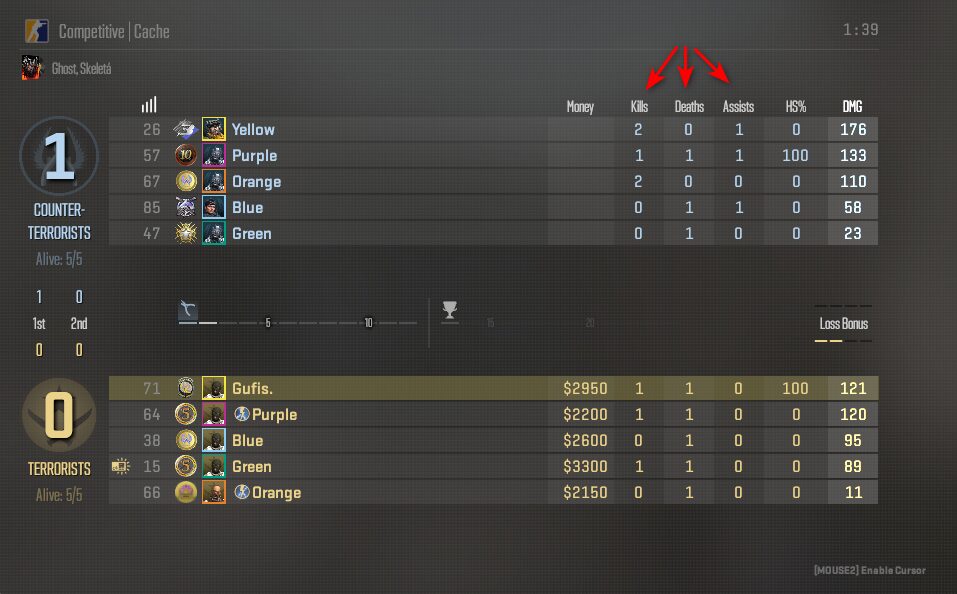
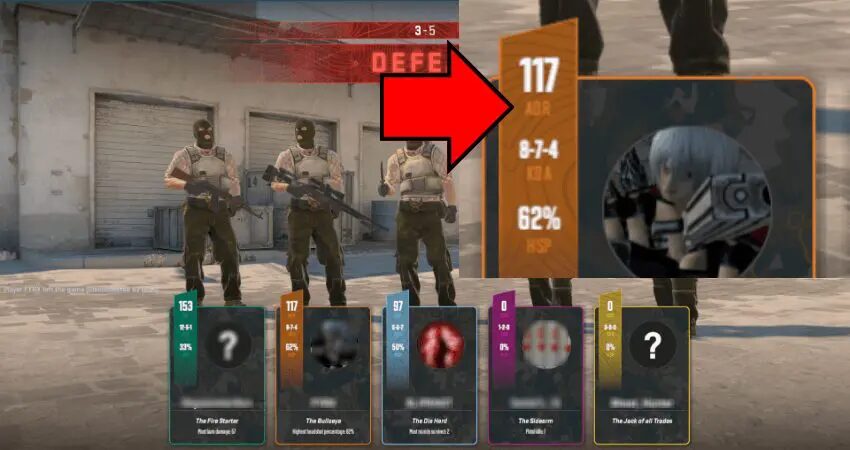
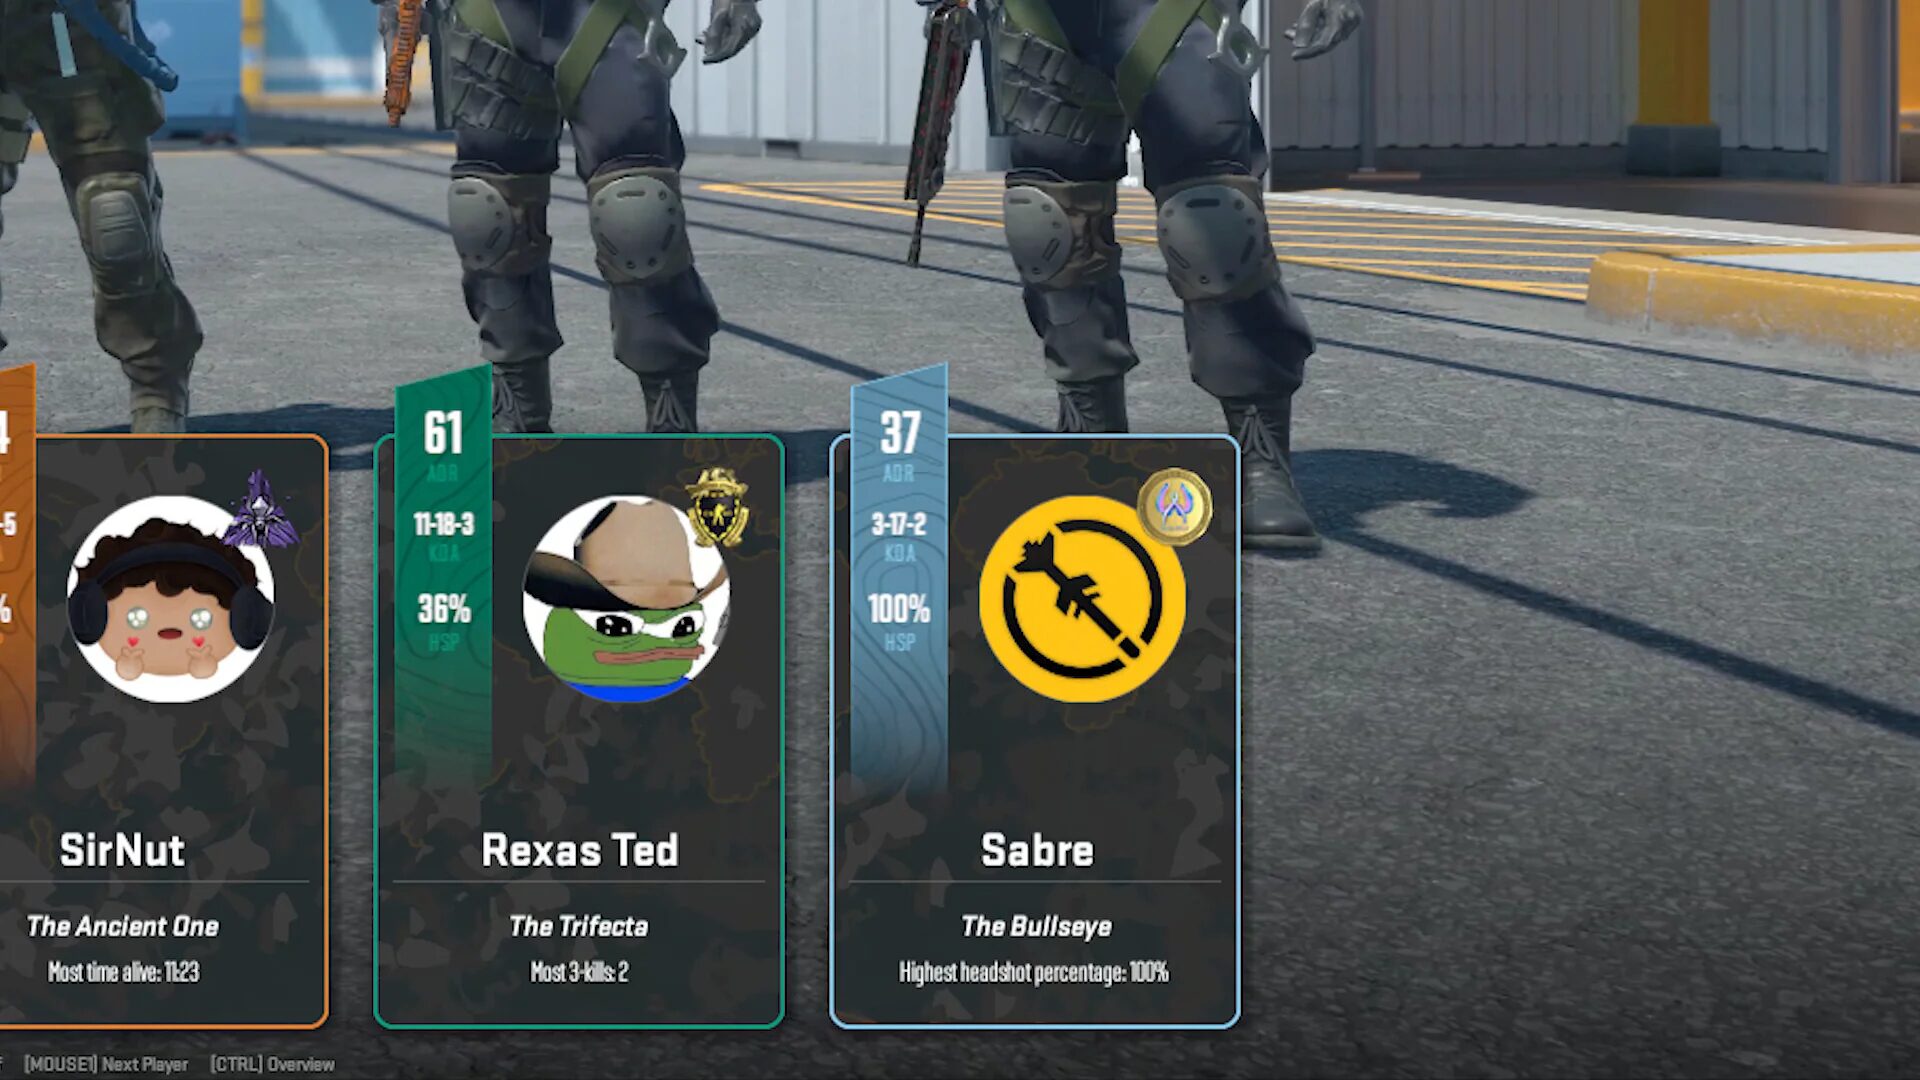
A CS2 scoreboard can tell you much more than who finished with the most kills. KDA, ADR, KAST, headshot percentage and opening duel statistics each measure a different part of a player’s performance.
The problem is that these numbers are easy to misread. A player can finish with a positive K/D while having little influence on the rounds that mattered. Another player might die frequently but create space, deal heavy damage and make every site entry easier for the team.
This guide explains the most important CS2 stats, how they are calculated and what they actually reveal about your performance.
Players looking for their match history can start with our guide on how to check CS2 stats.
CS2 Stats Quick Reference
| Stat | Meaning | What It Measures |
|---|---|---|
| K | Kills | Enemies eliminated |
| D | Deaths | Times you were eliminated |
| A | Assists | Kills you helped a teammate secure |
| K/D | Kill to death ratio | Kills divided by deaths |
| KDA | Kills, deaths and assists | Overall combat participation |
| ADR | Average damage per round | Damage dealt divided by rounds played |
| KAST | Kill, assist, survived or traded | Consistency across individual rounds |
| KPR | Kills per round | Average kills produced each round |
| DPR | Deaths per round | How frequently you die |
| HS% | Headshot percentage | Percentage of kills finished with a headshot |
| Opening Kills | First kills of a round | Success in initial engagements |
| Trade Kills | Revenge kills after a teammate dies | Team spacing and reaction speed |
| Rating | Combined performance score | Several statistics combined into one number |
No single statistic gives a complete picture. The most useful analysis comes from reading several stats together.
What Does KDA Mean in CS2?
KDA stands for kills, deaths and assists. It describes the three basic combat numbers attached to a player.
A stat line of 21 kills, 16 deaths and 6 assists may be written as 21/16/6.
Some platforms also calculate a KDA ratio:
KDA ratio = Kills + Assists ÷ Deaths
Using the example above:
21 + 6 ÷ 16 = 1.69 KDA
Parentheses matter when calculating it correctly:
(21 + 6) ÷ 16 = 1.69
However, KDA ratio is not used as consistently in Counter-Strike as it is in games such as League of Legends. CS2 players generally pay more attention to K/D, ADR, KAST and overall rating.
Assists also need context. Damaging an opponent before a teammate finishes the kill can produce an assist, but so can a well-placed flashbang. Both are valuable, although they represent different types of contribution.
What Is K/D Ratio?
K/D is calculated by dividing your kills by your deaths.
K/D ratio = Kills ÷ Deaths
A player with 20 kills and 16 deaths has a 1.25 K/D ratio.
| K/D Ratio | General Interpretation |
|---|---|
| Below 0.80 | More deaths than kills over the sample |
| 0.80 to 0.99 | Slightly negative |
| 1.00 | Equal kills and deaths |
| 1.01 to 1.20 | Positive performance |
| Above 1.20 | Strong fragging output |
These ranges are only rough guidelines. Rank, team role, map, opponent quality and sample size can all change what should be considered good.
A 1.05 K/D entry player may be creating more value than a 1.25 K/D player who avoids difficult fights and collects low-impact exit kills. K/D counts every kill equally, even though a round-opening rifle kill is usually more important than eliminating an unarmored opponent after the round has effectively been decided.
This limitation is one reason modern performance ratings use damage, economy, multi-kills and round context instead of relying entirely on kills and deaths. HLTV’s Rating 3.0, for example, adjusts parts of its calculation according to equipment and the difficulty of each duel.
What Does ADR Mean in CS2?
ADR means average damage per round.
It is calculated using a simple formula:
ADR = Total damage dealt ÷ Rounds played
If you deal 1,920 damage during a 24-round match, your ADR is 80.
ADR often reveals useful contributions that the kill column misses. You may hit three opponents during a site defence but only receive one kill before dying. Your teammates can then finish the weakened players more easily.
For a deeper breakdown, read our full guide to ADR in CS2 and learn how to see damage done in CS2.
What Is a Good ADR in CS2?
There is no official ADR target that applies to every player, but these ranges offer reasonable context:
| ADR | General Meaning |
|---|---|
| Below 60 | Low damage output |
| 60 to 74 | Moderate contribution |
| 75 to 89 | Solid damage output |
| 90 to 99 | Strong performance |
| 100 or higher | Exceptional over a meaningful sample |
An ADR of 80 is commonly treated as a solid benchmark because it represents consistent involvement in fights. It should not be treated as a magic number.
AWPers may record lower ADR because their kills often require only one shot. Entry players can produce high damage while also dying more frequently. Support players may sacrifice personal damage to throw utility, set up teammates or hold less active positions.
ADR is most useful when compared across multiple matches rather than one unusually good or bad game.
What Does KAST Mean?
KAST measures the percentage of rounds in which a player did at least one of the following:
K: Secured a kill
A: Recorded an assist
S: Survived the round
T: Was traded by a teammate
If you achieve one of those outcomes in 18 of 24 rounds, your KAST is 75%.
KAST is designed to measure round-by-round consistency. It rewards players who remain involved even when they are not top fragging.
A player can improve KAST by staying close enough to trade teammates, avoiding unnecessary deaths, creating assists and surviving rounds where keeping a weapon is the correct decision.
KAST also has limitations. Simply surviving does not always mean a player created value. A passive player can protect their survival statistics while leaving teammates in difficult situations. Modern rating systems therefore apply additional context rather than judging players through raw KAST alone. HLTV’s current Rating 3.0 uses an economy-adjusted KAST component alongside kills, damage, survival, multi-kills and Round Swing.
KPR and DPR Explained
KPR means kills per round.
KPR = Total kills ÷ Total rounds
A player with 18 kills across 24 rounds has a KPR of 0.75.
DPR means deaths per round.
DPR = Total deaths ÷ Total rounds
A player who dies 16 times across 24 rounds has a DPR of 0.67.
KPR and DPR are useful because they normalize performance across matches of different lengths. Comparing raw kills from a short 13 to 4 result with kills from an overtime match would be misleading. Per-round statistics make the comparison more balanced.
High KPR and low DPR usually produce an impressive K/D ratio, but role still matters. Entry players naturally take more opening fights, while passive AWPers and site anchors may have fewer engagements.
Headshot Percentage
Headshot percentage shows how many of your kills were completed with a headshot.
HS% = Headshot kills ÷ Total kills × 100
If 9 of your 18 kills were headshots, your HS% is 50%.
A high headshot percentage can indicate accurate first-bullet aim and strong crosshair placement. It does not automatically mean someone is a better player.
AWPers usually have lower headshot percentages because the AWP can kill with a body shot. Rifle players and pistol specialists normally produce higher percentages. A player who deliberately chases headshots can also lose fights that would have been won with controlled body shots.
Players trying to improve this statistic should work on crosshair positioning rather than forcing every shot toward the head. Our CS2 crosshair guide explains how to build a visible, consistent crosshair, while the CS2 aiming guide covers sensitivity and DPI.
Opening Kills and Opening Deaths
An opening kill is the first elimination of a round. Opening deaths measure how often a player is the first person eliminated.
The opening duel matters because it changes the round from a 5v5 into a 5v4. That advantage can force the opposing team to rotate, use additional utility or attempt a risky play.
Useful opening statistics include:
Opening kills: Total first kills secured
Opening deaths: Total times killed first
Opening duel attempts: How often a player participates in the first fight
Opening success rate: Opening kills divided by opening duel attempts
Team conversion rate: How often the team wins after the player secures the opener
A strong opening player does not simply take every available fight. The best entries choose fights that can be supported and traded.
HLTV’s Round Swing system adds further context by measuring how much each kill changes a team’s estimated probability of winning the round. It considers factors including the map, side, economy, bomb state and number of surviving players.
Trade Kills and Traded Deaths
A trade kill happens when you quickly eliminate the opponent who just killed your teammate.
Imagine your teammate enters Mirage A Ramp and dies to a defender playing Triple. You immediately eliminate that defender. The exchange becomes a trade.
Trading is especially important on the Terrorist side because attackers often need to move through narrow entrances. The first player creates contact, while the second player must remain close enough to respond.
A traded death means your teammate successfully eliminated the player who killed you. It can show that your positioning and spacing allowed the team to recover from your death.
Low trade numbers may reveal that a player is standing too far away from teammates, entering alone or reacting too slowly.
Practising small-team situations through CS2 1v1 matches and CS2 retake servers can improve reaction speed, positioning and duel preparation.
Utility Damage and Flash Assists
Utility damage measures damage caused by HE grenades, Molotovs and incendiary grenades.
A player can finish with average rifle statistics while still creating major advantages through utility. An HE grenade that deals 150 combined damage may allow teammates to win several easier fights.
Flash assists are recorded when a teammate eliminates an enemy who was sufficiently blinded by your flashbang. They help identify players who consistently create opportunities rather than only taking fights themselves.
Utility statistics should be reviewed alongside:
Grenades thrown
Enemies flashed
Average flash duration
Utility damage per round
Unused utility at death
Dying with a smoke, Molotov and two flashbangs still available can be more damaging than missing one rifle shot. Players can use our CS2 practice commands to practise grenade lineups and review our Inferno smokes guide for practical examples.
Multi-Kills
Multi-kill statistics track rounds in which a player secures two or more eliminations.
These are normally divided into:
2K rounds
3K rounds
4K rounds
Aces
Multi-kills matter because one player removing several opponents can completely break a defence or stop an entire execute.
A player with frequent 2K and 3K rounds may have greater round-winning potential than someone who collects the same total number of kills one at a time during lost rounds.
HLTV Rating 3.0 includes a dedicated Multi-Kill component. The system also uses economy context so eliminating several poorly equipped opponents is not valued exactly like winning several difficult full-buy duels.
Clutch Statistics
A clutch occurs when the final surviving player wins the round against one or more opponents.
Common clutch categories include:
1v1
1v2
1v3
1v4
1v5
Clutch totals are exciting, but they require context. A player cannot attempt a clutch unless the rest of the team dies first. That means raw clutch totals can partly reflect role, positioning and opportunity.
Clutch win percentage is often more useful than total clutches, provided the sample is large enough.
Demo review is the best way to evaluate clutch decisions. Our guide to CS2 demo controls explains how to replay rounds, slow down key moments and inspect positioning mistakes.
What Is HLTV Rating?
HLTV Rating is a combined score created to summarize professional player performance.
A rating of 1.00 represents the intended event-level average. Scores above 1.00 indicate above-average statistical performance, while scores below 1.00 indicate below-average performance within the system.
HLTV introduced Rating 3.0 in August 2025. Its six key components are kills, damage, survival, KAST, multi-kills and Round Swing. It also applies economy adjustments so easy anti-eco kills are not valued identically to difficult full-buy duels.
The complete formula remains proprietary. That means players should not attempt to recreate the rating by combining a few visible statistics.
Our ranking of the top CS2 players of 2026 shows how individual numbers can be evaluated alongside trophies, opponent strength, roles and team results.
CS Rating Is Not the Same as Player Rating
CS Rating is the number attached to your account in Premier mode. It is used for matchmaking progression and leaderboards.
A performance rating from a statistics platform attempts to summarize how well you played individually. The two numbers serve different purposes.
Valve describes CS2 as having CS Ratings alongside global and regional Premier leaderboards. Your CS Rating is therefore a competitive matchmaking measurement, not another name for ADR, K/D or HLTV Rating.
Competitive mode also uses map-specific ranks, while Wingman ranks operate within their own mode.
Which CS2 Stats Should You Focus On?
Start with ADR, KAST, opening duel results and deaths per round.
K/D tells you whether you are winning individual exchanges, but ADR shows how much damage you create. KAST measures consistency. Opening statistics reveal whether early aggression is helping or hurting the team. DPR can expose repeated unnecessary deaths.
Then review the actual rounds.
A statistic can show that something happened, but it cannot always explain why. Low ADR could come from poor aim, passive positioning, weak utility use or constantly receiving inferior weapons. High deaths could result from careless peeks, or from being the team’s designated entry player.
Use match statistics to locate a pattern, then use demos to understand its cause.
Players building their fundamentals can continue with our CS2 beginner’s guide, recoil control guide and guide to the best CS2 settings.
Final Thoughts
CS2 statistics are not simply numbers for deciding who carried the team. They are clues.
K/D measures kill efficiency. ADR measures damage. KAST measures round-to-round involvement. Opening stats track early impact, while trade and utility numbers reveal how well someone supports the players around them.
The best way to improve is to track these numbers across multiple matches, identify repeated weaknesses and then review the rounds responsible for them. A single scoreboard can be misleading. A consistent statistical pattern rarely is.